In the world of modern application development and infrastructure management, effective monitoring is crucial. Grafana provides a powerful platform for visualizing and alerting on various metrics. In this post, we will walk through setting up Grafana and configuring alerts.
We will use a setup that includes Prometheus and Process Exporter to monitor our environment. Grafana will be used to visualize the metrics and set up alerts. We will also use MailCatcher to test email-based alerts.
Prerequisites#
Before we start, ensure you have Docker and Docker Compose installed on your system.
Docker Compose Configuration#
Below is the Docker Compose file that will set up Prometheus, Grafana, Process Exporter, and MailCatcher.
version: '3.8'

networks:
  monitoring:
    driver: bridge

volumes:
  prometheus_data: {}
  grafana_storage: {}

services:
  grafana:
    image: grafana/grafana-oss
    container_name: grafana
    restart: unless-stopped
    ports:
     - '3000:3000'
    volumes:
     - 'grafana_storage:/var/lib/grafana'
    environment:
      - GF_SMTP_ENABLED=true
      - GF_SMTP_HOST=mailcatcher:1025
      - [email protected]
    networks:
      - monitoring

  process-exporter:
    image: ncabatoff/process-exporter
    container_name: process-exporter
    privileged: true
    volumes:
      - /proc:/host/proc:ro
      - ./filename.yml:/config/filename.yml
    command:
      - '--procfs=/host/proc'
      - '-config.path=/config/filename.yml'
    expose:
      - 9256
    networks:
      - monitoring
    depends_on:
      - prometheus

  prometheus:
    image: prom/prometheus:latest
    container_name: prometheus
    restart: unless-stopped
    volumes:
      - ./prometheus.yml:/etc/prometheus/prometheus.yml
      - prometheus_data:/prometheus
    command:
      - '--config.file=/etc/prometheus/prometheus.yml'
      - '--storage.tsdb.path=/prometheus'
      - '--web.console.libraries=/etc/prometheus/console_libraries'
      - '--web.console.templates=/etc/prometheus/consoles'
      - '--web.enable-lifecycle'
    expose:
      - 9090
    networks:
      - monitoring
    depends_on:
      - grafana

  mailcatcher:
    image: schickling/mailcatcher
    container_name: mailcatcher
    restart: unless-stopped
    ports:
      - "1080:1080"
      - "1025:1025"
    networks:
      - monitoring
Step-by-Step Setup#
-
Create Docker Compose File
Save the above Docker Compose configuration in a file named
docker-compose.yml. -
Create Prometheus Configuration
Create a
prometheus.ymlfile with the following content:global: scrape_interval: 10s scrape_configs: - job_name: 'prometheus' static_configs: - targets: ['prometheus:9090'] - job_name: 'process-exporter' static_configs: - targets: ['process-exporter:9256']This configuration file sets up Prometheus to scrape metrics from itself and the Process Exporter.
-
Create Process Exporter Configuration
Create a
filename.ymlfile for the process exporter:process_names: - name: "{{.Comm}}" cmdline: - '.+' -
Start Services
In the directory containing your
docker-compose.yml, run the following command:docker-compose up -dThis command will start all the services in the background.
⚠️ If there are any issues use
docker logs $container_nameto check the logs.
Access Grafana#
Open your browser and go to http://localhost:3000. The default login credentials are:
- Username:
admin - Password:
admin
Adding Data Source#
- In Grafana, navigate to Configuration -> Data Sources.
- Click Add data source.
- Select Prometheus.
- Set the URL to
http://prometheus:9090. - Click Save & Test.
Setting Up Email-Based Alerts#
In Grafana:
- Go to Alerting -> Contact points.
- Click Contact point.
- Name your contact point and select Email as the type.
- Enter the recipient email address.
- Save the contact point.
Setting Up Alerts#
We want to monitor the chrome browser procces in this test.
- Navigate to the Alert tab.
- Click Create Alert.
- In new alert page add the following query.
namedprocess_namegroup_num_procs{groupname="chromium-browse"}
4. Set Threshold to monitor input A and alert if below 1.
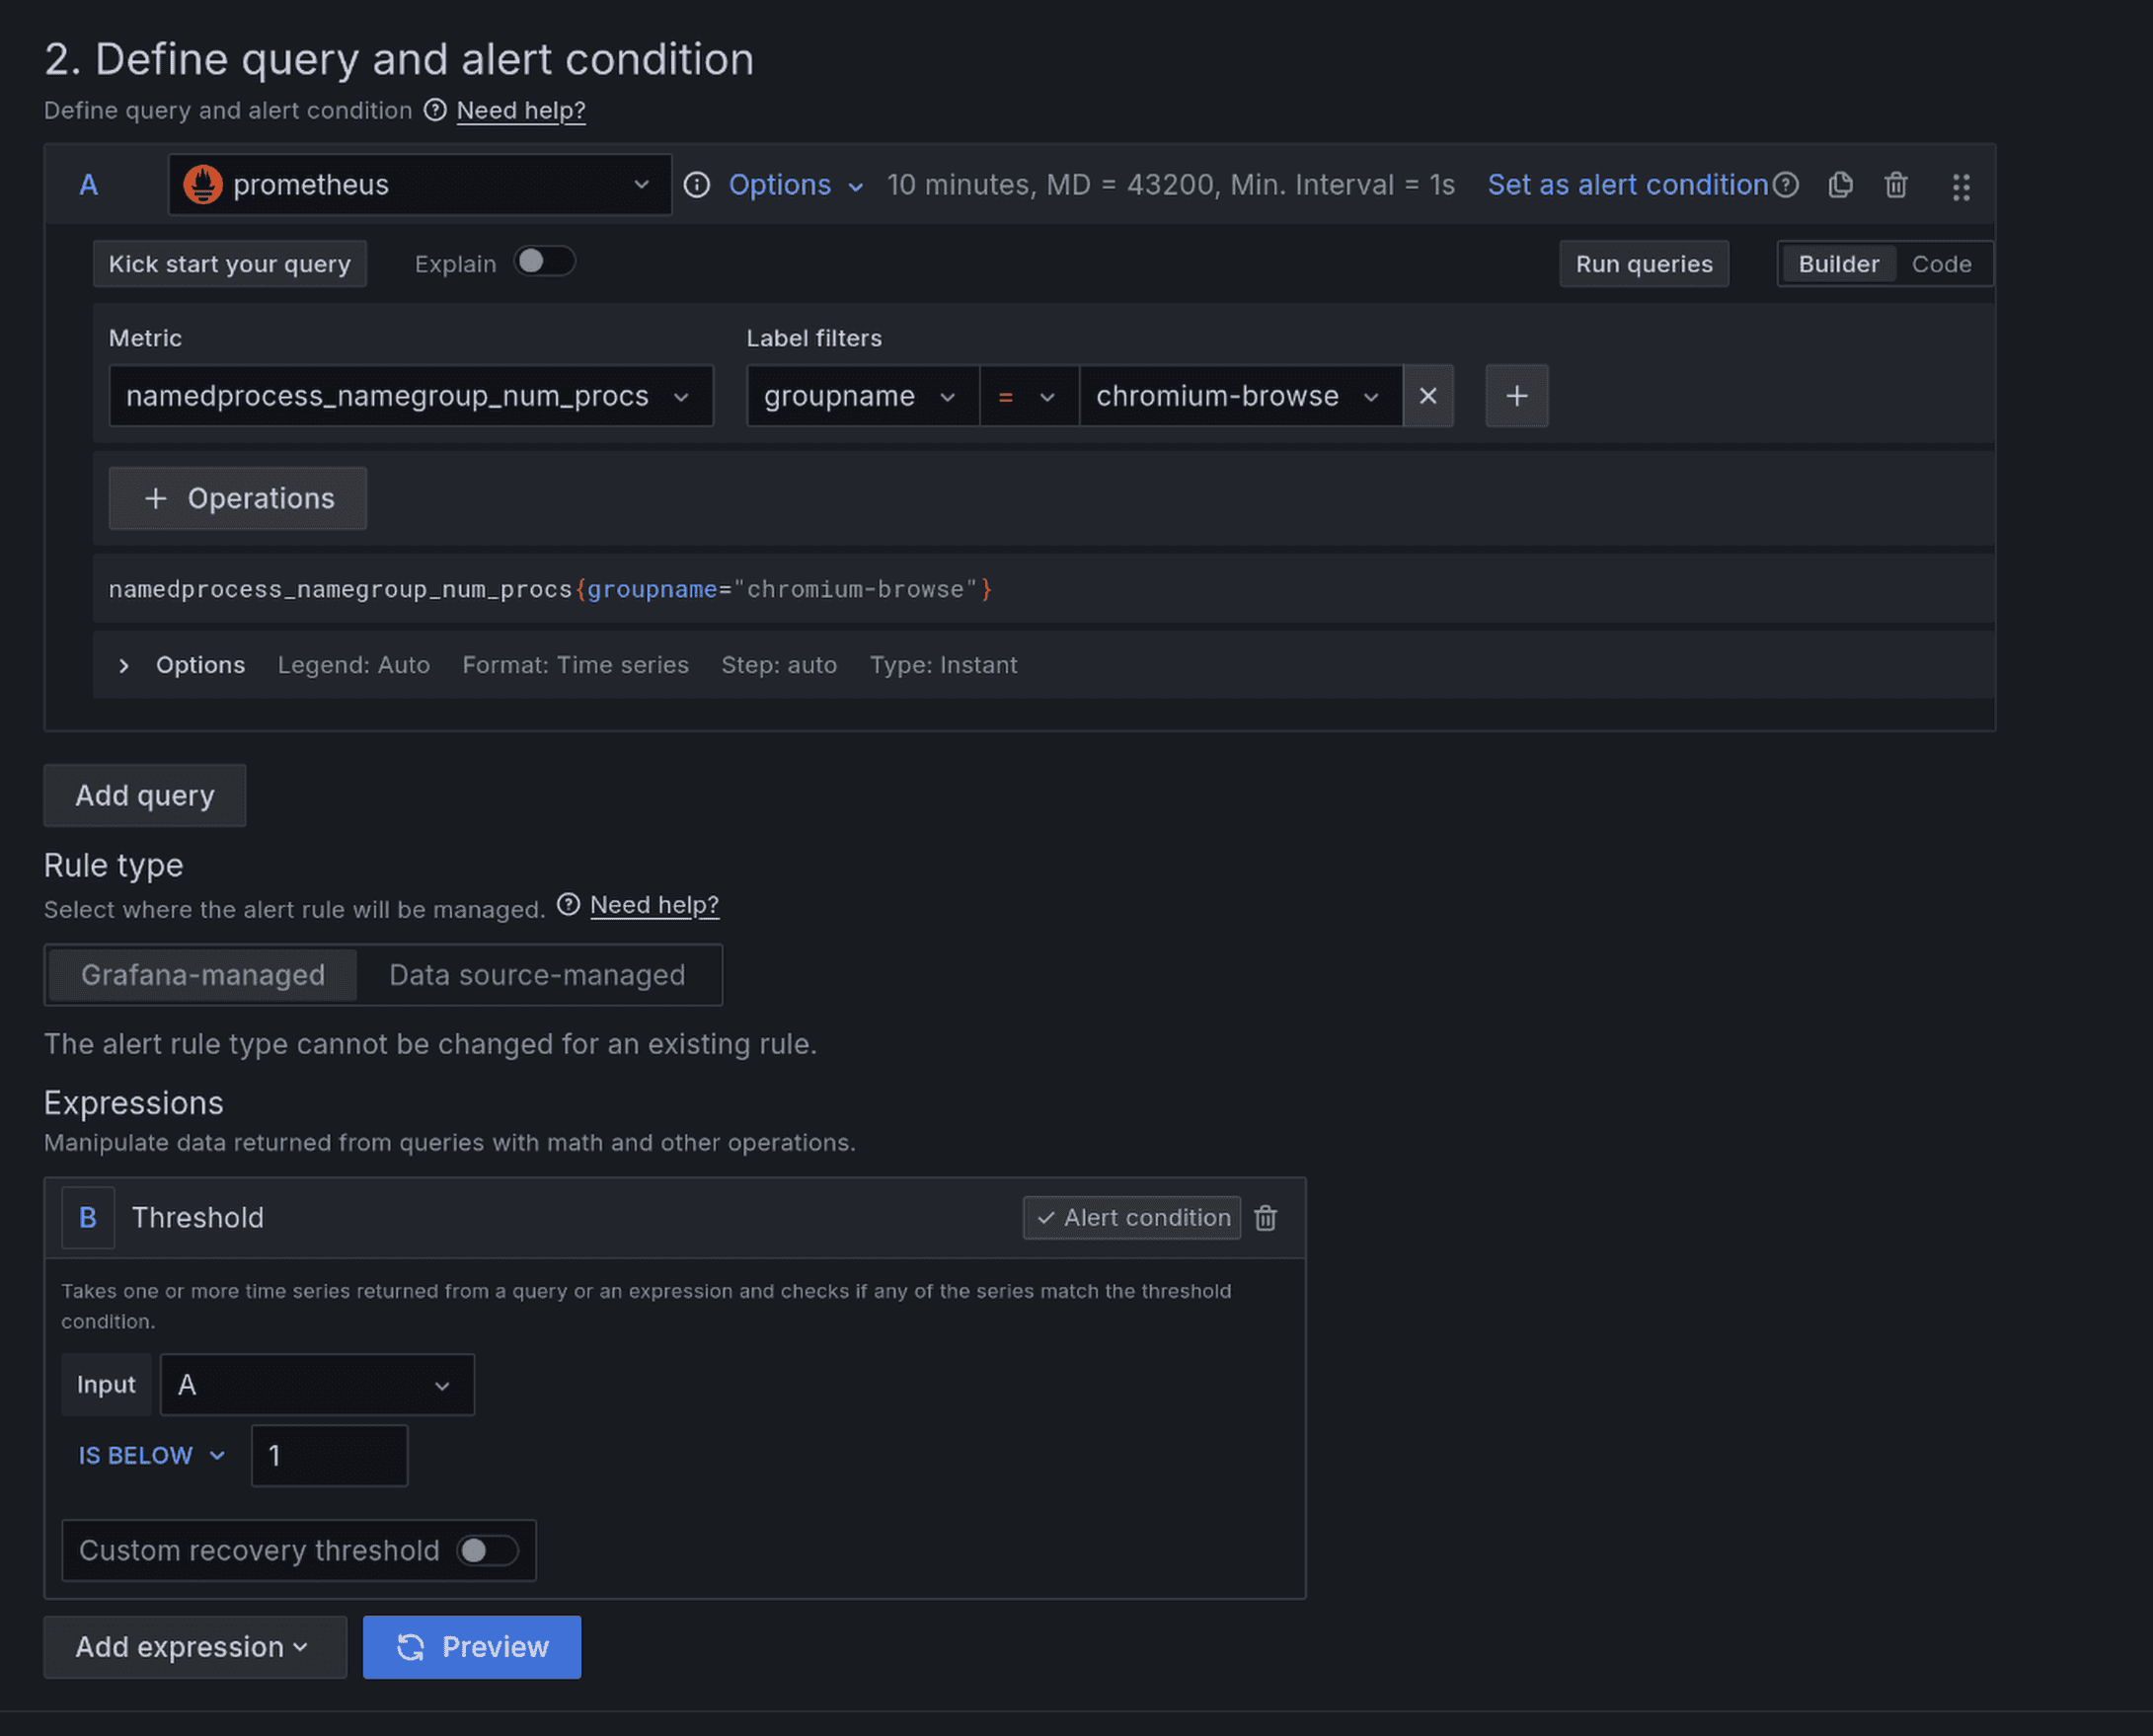
- select the email contact point configured previously.
- Save the alert.
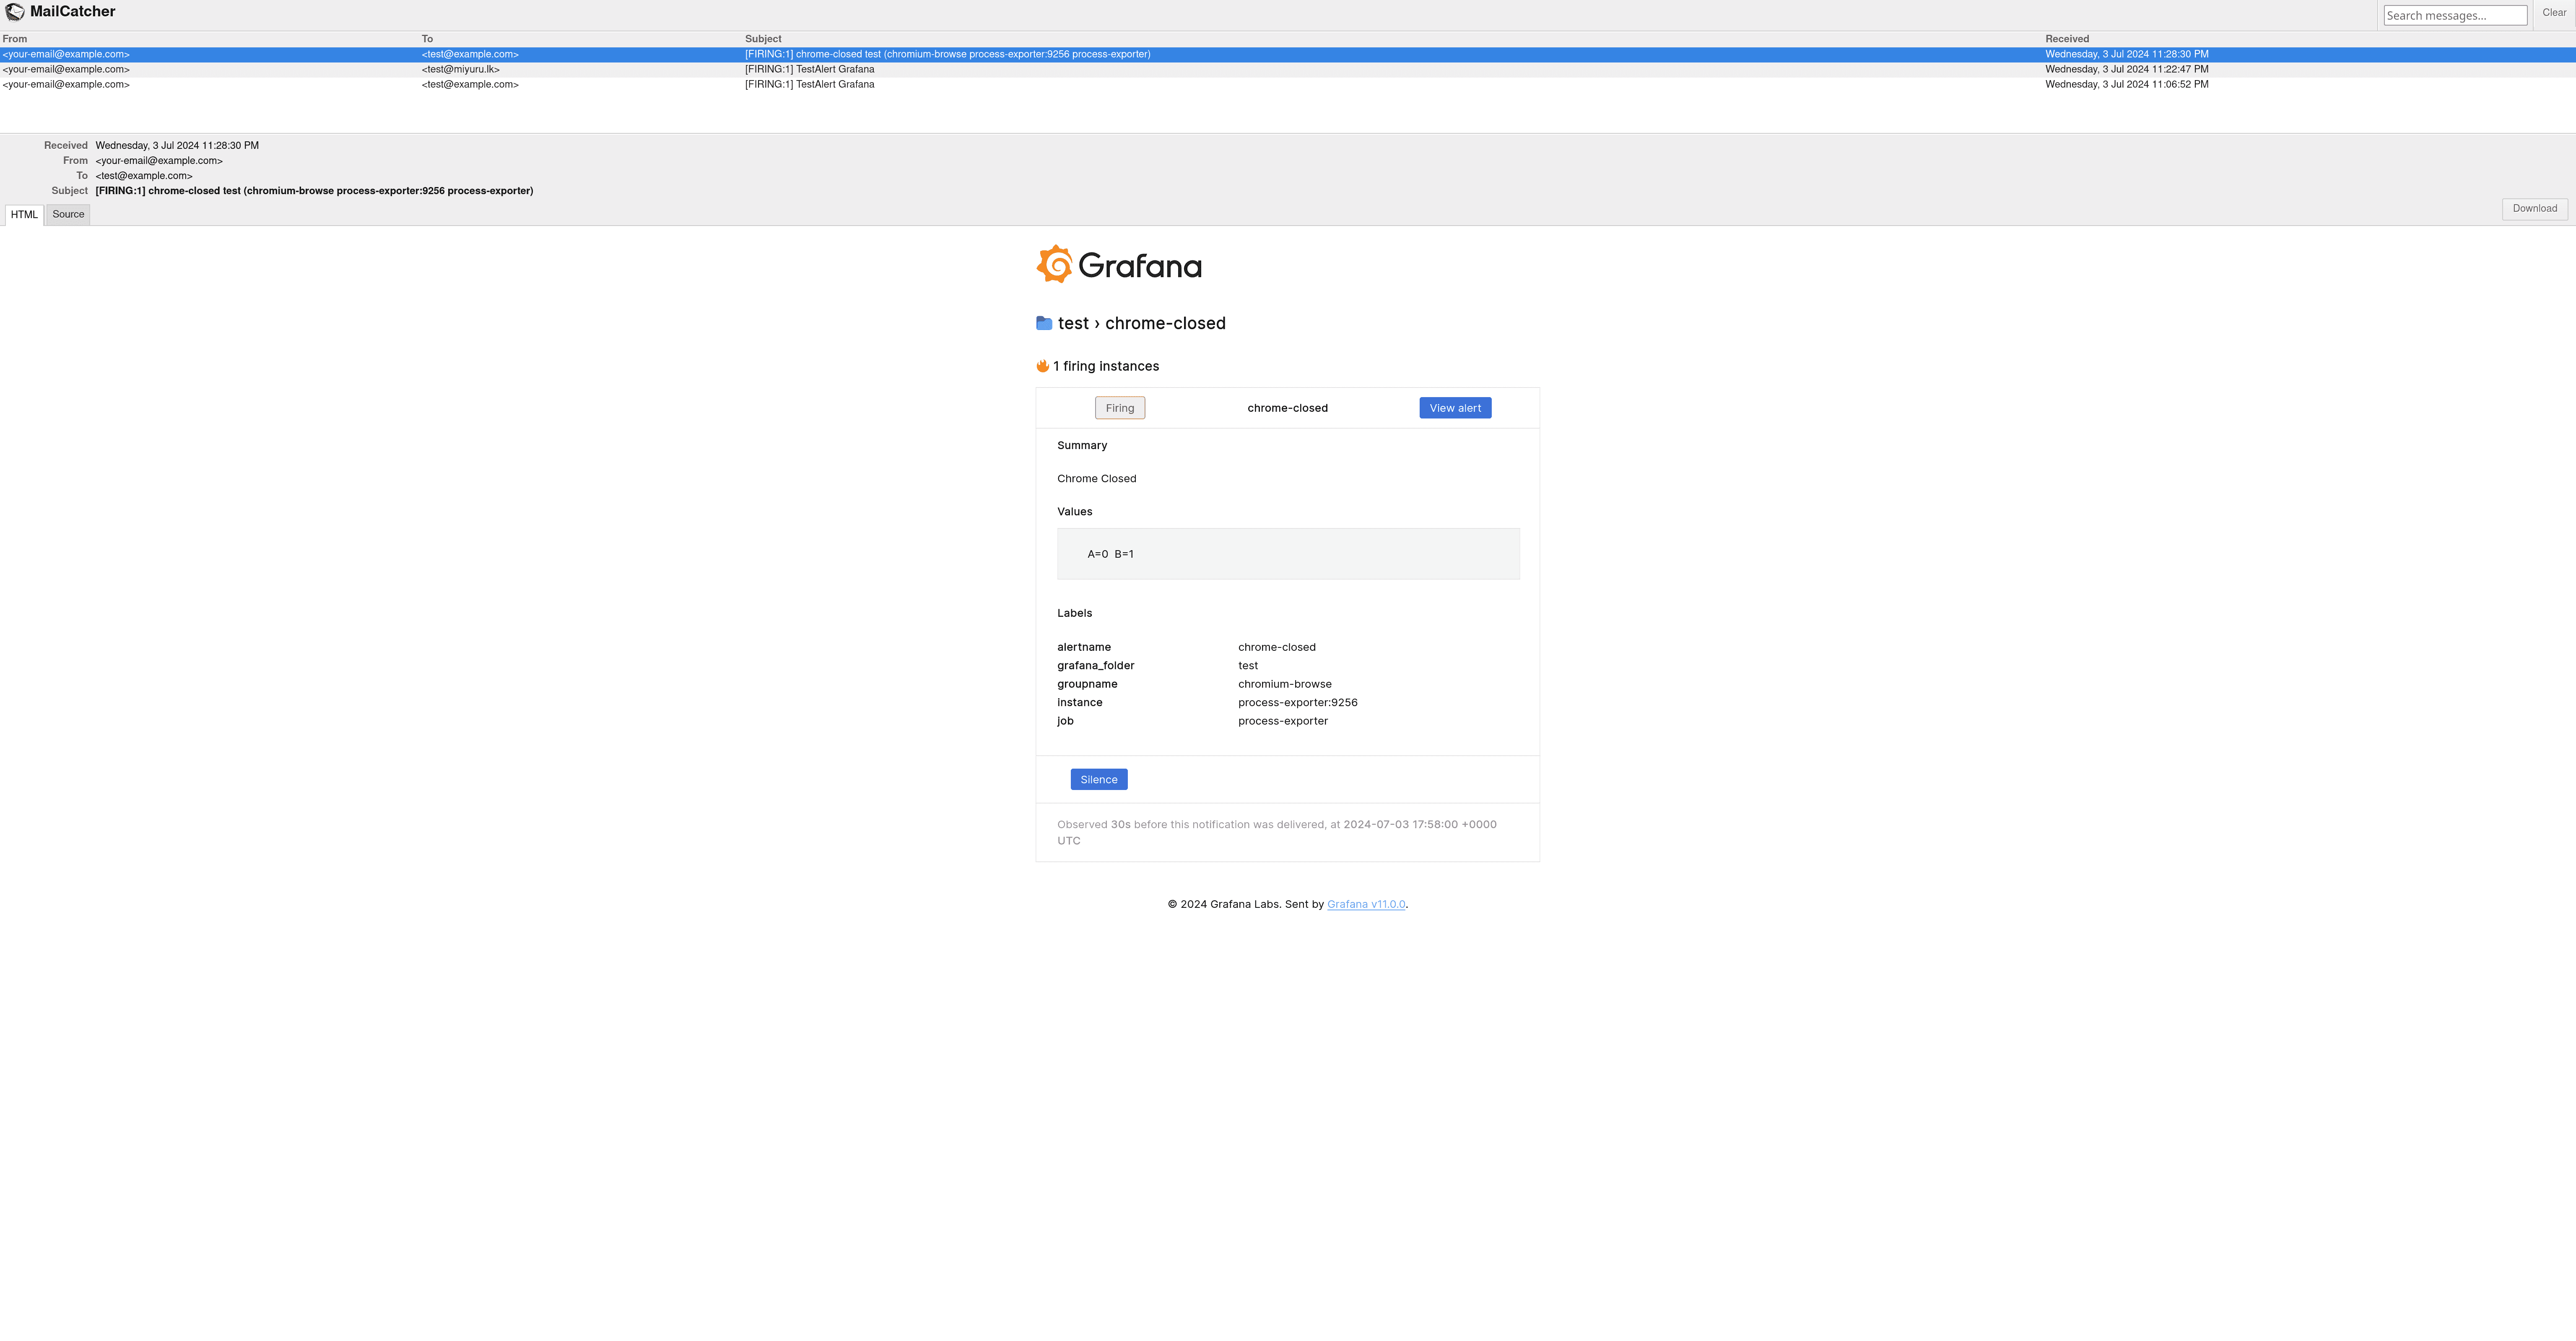
Test Email Alerts#
To test the email alerts, open your browser and go to http://localhost:1080 to access MailCatcher’s web interface.
Open and close the chrome browser and wait a few minutues.
You should see the email notification in the web UI and that the alert is triggerd on the grafana UI.